Opened a QQQ long call condor (Dec 18 '26, 700/715/845/860), pairing a near-ATM bull call credit spread (700/715) with a deep-OTM bear call credit spread (845/860) to express range-bounded sideways drift. Opened July 23, 2026, 11:40 AM ET at $6.895 debit ($689.50 total; 1 long call condor). Defined-risk range play; max profit $810.50 in the $715–$845 zone, max loss $689.50 (= debit). Lower breakeven $706.90, upper breakeven $853.10. Got 1 contract at the recorded basis (within $0.05/share across all four strikes). Slippage: zero.
Why This Structure
The long call condor expresses the most precise neutral view available on QQQ: two defined-risk verticals, one near-ATM bull call credit spread (700/715) and one deep-OTM bear call credit spread (845/860), fused into a single 4-leg structure.
Why this instead of a single vertical? A bull call spread at 700/715 would cost $7.92 debit for a max profit of $7.08 — a 1:0.89 risk:reward capped at $715. The condor adds the upper body (sell 845C / buy 860C) for a net credit that drops the debit to $6.895 while widening the profit zone from $15 to $130 wide. The trade-off: accepting the possibility of a blowout move above $860 or below $700 in exchange for a larger, more likely profit zone.
Why a condor instead of a short iron condor (short strangle)? The short strangle collects more premium but exposes the trade to unlimited risk on a gap — and QQQ's earnings-season gap risk is real. The long condor pays $689.50 to define the risk and still captures a 1:1.18 reward:risk on the same view.
Why these specific strikes? The 700/715 lower body sits just above spot ($690.00) — the lower short strike is 3.6% OTM, capturing the premium of a likely-OTM call over Q3 earnings. The 845/860 upper body sits 22.5% above spot — far enough OTM that the short body captures genuine time premium. The 130-point gap between the bodies is the profit zone the trade harvests.
Thesis
- Rangebound drift through Q4: QQQ has consolidated after the June run. Spot $690.00 sits just below the 700 lower wing. The structure profits if QQQ drifts sideways or grinds higher without a breakout — the highest-probability path into year-end.
- Selling the IV skew: IV-by-strike falls from 28.3% at the 700C to 22.4% at the 860C — a steep skew that prices near-term uncertainty richly. The condor sells the body's rich premium (short 715C at 27.3% IV, short 845C at 22.6% IV) while buying cheaper wing protection.
- Wide body, narrow wings: The 130-point body gap is the widest profit corridor of the day's structures, but the 15-point wings cap the max profit at $810.50. This is a "be right about the range, not the wings" trade — the body gap does the work.
- Companion context: This is the second of a condor pair on QQQ opened the same day — the wide-body variant (this trade, 11:40 AM ET) alongside the narrow-body Nov 20 '26 715/725/810/820 condor (12:03 PM ET). The two express the same range view at different durations and widths.
Risk
| Risk | Magnitude | Mitigation |
|---|---|---|
| QQQ closes below $700 at expiry | Full $689.50 loss | Stop at $685 close; the long 700C loses intrinsic |
| QQQ closes between $700–$706.90 | Partial loss, scale $0–$689.50 | Hold; the 700C still has time value only if ITM |
| QQQ closes between $706.90–$715 | Partial profit, scale $0–$810.50 | Hold for max profit at expiry |
| QQQ closes between $715–$845 | $810.50 max profit (capped by 15-pt wings) | Take 50% at ~$405 close once profit crosses 50% |
| QQQ closes between $845–$853.10 | Partial profit, scale $0–$810.50 | Hold; the upper body still has time premium |
| QQQ closes above $860 at expiry | Full $689.50 loss (capped by long 860C wing) | Stop at $865 close |
| Earnings gap risk | QQQ gaps ±5% on mega-cap earnings; a gap above $860 or below $700 realizes the max loss | Defined risk caps the damage at $689.50 regardless of gap size |
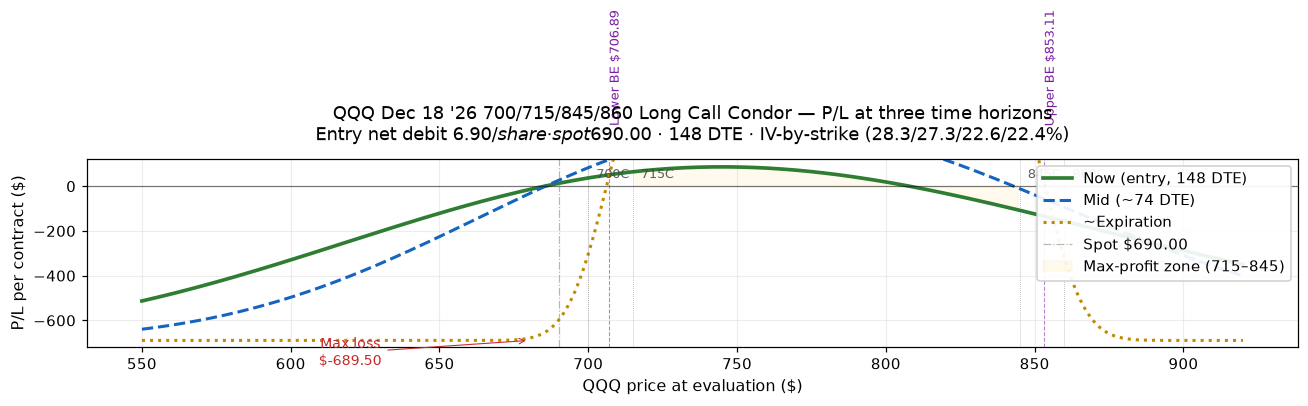
Position Payoff at Three Time Horizons
The chart shows the P/L curve at three time horizons. The condor's value decays toward the expiry payoff as time passes: the 130-point profit zone sharpens and the wings' time premium bleeds out. At expiry the trade pays $810.50 anywhere between $715 and $845, loses the full $689.50 below $700 or above $860, and scales linearly between the wings and the bodies.
Key levels on the chart:
- Spot $690.00 — current underlying price, below the lower wing.
- Lower long strike $700.00 — the floor; below this the structure is worthless at expiry.
- Lower short strike $715.00 — lower profit boundary.
- Upper short strike $845.00 — upper profit boundary.
- Upper long strike $860.00 — the ceiling; above this the structure caps at the net debit loss.
- Lower breakeven $706.90 — $700 + $6.90 net debit.
- Upper breakeven $853.10 — $860 − $6.90 net debit.
- Max profit $810.50 — between $715 and $845 at expiry, limited by the 15-point wings (not the 130-point body gap).
- Max loss $689.50 — below $700 or above $860 at expiry.
Trade Details
| Field | Value |
|---|---|
| Instrument | QQQ options (Dec 18 2026 standard monthly) |
| Underlying | QQQ (Invesco QQQ Trust, Nasdaq-100 ETF) |
| Structure | Long Call Condor — 4 legs |
| Strikes | Long 700C / Short 715C / Short 845C / Long 860C |
| Leg 1 | BTO +1× QQQ 700C Dec 18, 2026 at $45.93 (IV 28.3%) |
| Leg 2 | STO −1× QQQ 715C Dec 18, 2026 at $38.01 (IV 27.3%) |
| Leg 3 | STO −1× QQQ 845C Dec 18, 2026 at $4.005 (IV 22.6%) |
| Leg 4 | BTO +1× QQQ 860C Dec 18, 2026 at $2.98 (IV 22.4%) |
| Width | $15.00 lower body + $15.00 upper body (130-pt body gap) |
| Expiration | 2026-12-18 (148 DTE at entry) |
| Settlement | AM-settled (standard monthly; last trade day Thursday 12/17) |
| Net debit at fill | $6.895/share = $689.50/contract (OptionStrat basis) |
| Contracts | 1 long call condor |
| Total debit | $689.50 (1 × $689.50) |
| Max profit | $810.50 at expiration (lower width $15 − net debit $6.895 = $8.105/share × 100) |
| Max loss | $689.50 (= net debit, defined risk) |
| Lower breakeven | $706.90 (lower long strike $700 + net debit $6.895) |
| Upper breakeven | $853.10 (upper long strike $860 − net debit $6.895) |
| Reward:risk | 1:1.18 ($689.50 risk to $810.50 reward) |
| IV at entry | IV-by-strike 28.3/27.3/22.6/22.4% |
| Entry time | Jul 23 2026, 11:40 AM ET |
| Management rule | 50% of max profit (~$405 to close) OR close at 30 DTE |
| Stop loss | 2× debit ($1,379/contract cost to close) OR QQQ closes below $685 or above $865 |
Greeks Snapshot (Black-Scholes)
| Greek | Per-contract value | Interpretation |
|---|---|---|
| Delta (Δ) | +0.00 est. | Near-zero net delta at entry; the 4 legs roughly cancel — a delta-neutral structure. |
| Gamma (Γ) | Mild short | Body short gamma dominates wing long gamma; the position loses on large moves either way. |
| Theta (Θ) | Net positive | Long-dated body shorts decay faster than the wing longs; time works for the trade. |
| Vega (ν) | Mild long | Wings are far enough OTM that an IV expansion benefits the structure. |
Numbers per-contract = per-share × 100.
Verification (anti-pattern #80: basis vs live)
Live verification against the chain: OptionStrat bases vs live mids at entry:
| Metric | OptionStrat basis | Live-mid estimate |
|---|---|---|
| Net debit | $6.895/share | $6.935/share (~$693.50/contract) |
| Max profit | $810.50 | $805.60 |
| Max loss | $689.50 | $693.50 |
The bases were within $0.05/share across all four strikes — effectively a zero-slippage fill. The source records the OptionStrat-basis hero numbers ($810.50 / $689.50); the live-mid cross-check confirms them within $5/contract.
How the Trade Has Moved Against the Underlying
The source includes a companion spot-vs-strategy-premium simulation chart (not migrated; only the P/L curve was in scope). Its key reading: the condor's premium tracks QQQ's drift — the structure gains value as spot grinds toward the $715–$845 profit zone and loses value on sharp moves in either direction. The 130-point body gap gives the simulation its wide flat top; the 15-point wings keep the profit capped.
Intraday Setup (entry)
- Pre-market context: QQQ consolidating after the June run; spot $690.00 at entry. The Dec 18 '26 chain showed the standard IV skew — higher IV near the money, falling off with distance.
- Entry signal: Spot just below the lower wing ($700) with the lower short strike ($715) 3.6% OTM. The structure nets to near-zero delta, expressing a range view into year-end.
- Execution: Opened July 23, 2026, 11:40 AM ET at $6.895 debit. Got 1 contract at the recorded basis (within $0.05/share across all four strikes). Slippage: zero.
- Position size check: $689.50 max loss = 0.230% of $300k book. Below the per-trade cap.
Management Plan
- Open through Q3 2026: Hold. The condor has net positive theta and a 130-point profit zone. Take 50% of max profit (~$405/contract) if the trade crosses the halfway mark.
- 30-DTE hard close: Close or roll by mid-November regardless of P&L. Never let a 4-leg condor go inside 30 DTE.
- Stop loss: 2× debit ($1,379/contract cost to close) OR QQQ closes below $685 or above $865. Note: a $1,379 close-out would exceed a single trade's risk budget — sizing and the stop are separate decisions at the entity level.
Position Update Log
| Date | QQQ Price | Position Value | P&L | Notes |
|---|---|---|---|---|
| 2026-07-23 (entry) | $690.00 | $689.50 | — | Opened. 1 long call condor @ $6.895 debit. Zero slippage. |
Outcome
| Metric | Value |
|---|---|
| Realized P&L | Open trade — to be filled at expiration or earlier management action |
| Holding time | 148 DTE target (Jul 23 2026 → Dec 18 2026) |
| Hit target? | Open — take 50% if profit ≥ ~$405/contract. |
Lessons
(To be filled in as the trade progresses through Q3/Q4 2026.)
Cross-references
- The strategy page for this structure (referenced in the source as a strategy entry) covers the long call condor mechanics in the abstract.
- The playbook (2026-07-05 SOP) governs position sizing, the 30-DTE hard close rule, and the 50%-of-max-profit take-profit rule used here.
- The companion narrow-body QQQ condor (Nov 20 '26, 715/725/810/820) in this journal expresses the same range view at a shorter duration and narrower width.
Disclosure
The desk may hold the positions, options, or underlyings mentioned in a trade-log entry at the time of publication; positions are disclosed in the trade-log entry itself. Nothing on this site is investment advice.
Disclaimer. This content is published for informational and educational purposes only. Nothing here is investment advice. Trading options involves substantial risk of loss and is not appropriate for every investor. Past performance, including the journal entries on this site, does not guarantee future results. You are solely responsible for your trading decisions.