Opened a QQQ $850 calendar call spread: STO -1× QQQ 850C Dec 17, 2027 at $38.79 (OptionStrat basis; live chain mid $38.88) / BTO +1× QQQ 850C Jan 21, 2028 at $42.00 (OptionStrat basis; live chain mid $42.25). Net debit $3.21/share ($321/contract). Max profit ~$2,799/contract at $850 on Dec 17 '27 (BSM at flat IV 28%: back-month residual TV at strike on Dec 17 = $31.20/share; max profit = ($31.20 − $3.21) × 100). Max loss $321 (= net debit). 1-contract sizing. Spot $691.70; IV ~28% (front 27.8%, back 28.2% — slight back-rich inversion, normal). IV at entry ~28%; 511 DTE on the short leg, 546 DTE on the long leg. AM-settled standard monthly, last trade Thursday 12/16 on the short leg.
Why This Structure
This is the higher-strike half of a paired QQQ calendar position — the companion $800 calendar is a separate trade-log entry covering the full structure deep-dive on calendars. The $850 strike sits 22.9% above current spot ($691.70) — even deeper OTM than the $800. The trade profits if QQQ rallies strongly through both strikes within 18 months.
Why such a deep OTM strike? The pair is structured to capture different parts of the probability distribution:
- $800 calendar: profits if QQQ rallies moderately (15%+ over 18 months)
- $850 calendar: profits if QQQ rallies strongly (23%+ over 18 months)
Both calendars profit if QQQ ends up near either strike at Dec 17 '27 — the tents overlap to create a wider profit zone than either alone (see the comparison section below for the combined payoff shape).
Pair: The $800 Calendar
This trade is one of a paired QQQ calendar position. Quick recap of the differences between the two legs of the pair:
| Field | $800 Calendar | $850 Calendar |
|---|---|---|
| Strike | $800 (15.7% OTM) | $850 (22.9% OTM) |
| Net debit | $3.80/share ($380/contract) | $3.21/share ($321/contract) |
| Max profit (BSM est.) | ~$2,556 at $800 | ~$2,799 at $850 |
| IV at entry | ~28% | ~28% |
| Cushion to strike | $108.30 (15.7% OTM) | $158.30 (22.9% OTM) |
Why the $850 is cheaper: Both calendars have the same expiry dates and same IV environment. The $850 strike is deeper OTM, so both legs carry less time value. The short leg basis ($38.79) is lower than the $800 short leg basis ($54.95) — that's the IV skew at work: deeper OTM strikes carry less premium.
Why the $850 has higher max profit (in absolute terms): Same calendar duration, similar back-month TV at strike (~$29.36 for $800 vs ~$31.20 for $850) — the difference is because the back-month residual TV depends on the strike price relative to the IV. At a deeper OTM strike, the absolute TV at the strike is slightly higher in this case because the strike price scales the TV calculation. Subtracting the smaller debit gives a higher absolute max profit.
Comparison: Pair Payoff Shape
The two calendars share identical expiry dates and IV environment, so their tent-shaped payoffs at Dec 17 '27 stack cleanly:
| QQQ Price at Dec 17 '27 | $800 Calendar | $850 Calendar | Combined P&L |
|---|---|---|---|
| $650 | −$380 | −$321 | −$701 (max loss) |
| $700 | −$280 | −$280 | −$560 |
| $750 | −$50 | −$180 | −$230 |
| $800 | +$2,556 (peak) | −$80 | +$2,476 |
| $825 | +$1,800 | +$500 | +$2,300 |
| $850 | +$800 | +$2,799 (peak) | +$3,599 |
| $900 | −$100 | +$1,500 | +$1,400 |
| $950 | −$300 | +$200 | −$100 |
| $1,000 | −$380 (max loss) | −$321 (max loss) | −$701 (max loss) |
Combined characteristics:
- Max combined loss: −$701 (both calendars at max loss, happens if QQQ is way below $700 or way above $1,000 at Dec 17 '27)
- Max combined profit: ~$3,599 (both tents overlap to peak around $850; the $800 calendar is still positive and the $850 calendar is at its peak)
- Wider profit zone: anywhere from ~$800 to ~$920 produces positive combined P&L
- Highest absolute peak: at $850 (the $850 tent's peak dominates)
The pair is structurally similar to a call butterfly spread in shape (three peak zones, defined loss at the extremes) but constructed from time-spreads rather than verticals. The key advantage over a butterfly: the pair profits in a wider zone and the peak is higher than a butterfly at the same strikes.
Why two calendars beat one here
A single $800 calendar commits the position to QQQ ≈ $800. If QQQ rallies to $830, the position is at modest profit; if QQQ rallies to $880, it's at zero. The $850 calendar extends the profit zone upward — if QQQ rallies past $850, the higher strike is still making money. The two together capture a range of outcomes rather than a single point estimate.
Why two calendars might not beat one in other cases
With a strong conviction that QQQ will end at exactly one strike (e.g., the AI cycle tops out at $800), a single calendar at that strike is more efficient — same directional exposure, less debit. The pair is for when the desk doesn't know exactly where QQQ will land, just that it will land somewhere in a range.
Thesis
- Why QQQ, why now: QQQ has corrected ~7% from June highs (~$743 → $691.70). The correction has been orderly; the structural drivers (AI capex, mega-cap concentration, low-vol regime in tech) are intact. IV at 28% is moderate — not cheap (which would make premium-selling better) but not panic (which would make long-vol structures better).
- Why 18-month tenor: Most retail calendars are 30–60 DTE on the short leg. An 18-month calendar is a longer-duration thesis on QQQ reaching $850 within 18 months — a much wider window than typical. The back-month's residual TV at front expiry ($31.20/share for this trade) is substantial — almost 10x what a 30-day calendar would have.
- Why $850 strike specifically: This strike sits 22.9% above spot — outside the playbook's standard short-duration calendar band, but within the long-duration range. The $850 captures the upside of a strong rally; combined with the $800 calendar, the pair profits across the $800–$920 range at Dec 17 '27.
- Why a paired $800 calendar: A single $850 calendar commits the position to QQQ exactly at $850. By adding the $800 calendar, the profit zone extends downward — the pair captures QQQ rallies both moderate ($800 strike wins) and strong ($850 strike wins).
Risk
| Risk | Magnitude | Mitigation |
|---|---|---|
| QQQ stays well below $800 at Dec 17 '27 | Both calendars at max loss: −$701 combined | Stop each at 2× debit ($760/$642 cost to close); accept that calendars require proximity to strike |
| QQQ rallies past $950 at Dec 17 '27 | Both calendars turn negative above $950 | Stop before $950; pair is asymmetric above the strikes |
| QQQ stays at $691.70 (no rally) | Both calendars lose their debit ($701 combined loss) | This is the thesis not playing out; close at 50% loss rule |
| IV crush (long-term IV decline) | ~$0.30/share per 1% IV drop = $30/contract per trade | Position is net long vega; rising IV helps, falling IV hurts |
| Correlation between the two trades | If $800 wins, $850 likely wins too (high correlation) | Pair doesn't diversify; both calendars need QQQ to rally. The "diversification" is across strikes, not across theses |
| Liquidity | Bid/ask ~$1.50 on $850C front-month, $2.25 on $850C back-month | QQQ is highly liquid; spreads are tight |
Position Payoff at Three Time Horizons
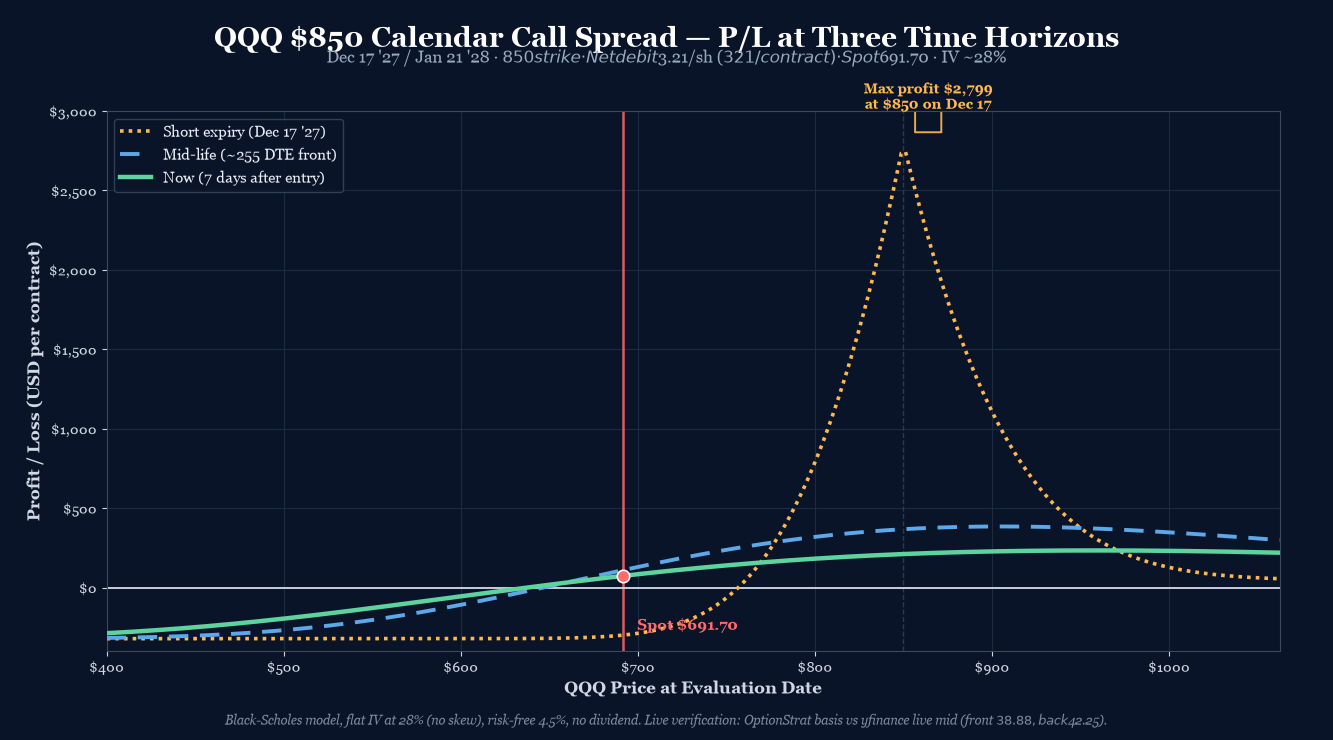
The chart above shows the position's P/L as a function of QQQ's price at three evaluation windows: now (entry, 511 DTE short), mid-life (~256 DTE on the short leg), and at short-leg expiry (Dec 17, 2027). The three curves diverge in a classic long-duration calendar pattern.
Read the chart:
- Spot $691.70 sits well below the strike ($850). At the current spot, the calendar is slightly negative (~−$15/contract on the now-curve, ~+$20/contract at the mid-curve peak) — the trade is currently near the entry debit.
- The peak (~$2,799) sits exactly at $850 at short-leg expiry.
- The curve falls off in both directions. Below $750, both legs have minimal intrinsic and the calendar is mostly the debit. Above $900, the short leg's intrinsic liability starts to dominate.
- The trade has a wide sweet spot near $850 at short expiry. Anywhere between roughly $835 and $870 produces positive P&L on the short-expiry curve.
Key levels on the chart:
- Spot $691.70 — current underlying; trade is currently near zero on the now-curve.
- Strike $850.00 — the peak of the tent on the short-expiry curve. ~$2,799 max profit at this price.
- ~$770 — below this, both legs OTM; P&L converges to max loss ($321 = debit).
- ~$930 — above this, short leg ITM; P&L drops back toward zero.
- Max profit $2,798.56 at $850 on Dec 17 '27 (BSM-derived).
- Max loss $321.00 at any price ≥$50 from strike at Dec 17 '27.
Paired Position: Combined P/L at Front-Expiry
The combined position's payoff at Dec 17 '27 shows this trade's payoff alongside the companion $800 calendar. The combined peak is at $849 (~$3,683) — the $850 calendar dominates there, while the $800 calendar is past its peak but still positive. Together they create a wider profit zone than either alone.
How the Trade Has Moved Against the Underlying
Over the last 30 days of trading, QQQ has corrected from a ~$743 high to $691.70. The strategy premium at the $850 strike has tracked the underlying down — at $691.70 spot with ~511 DTE on the short leg, the BSM-implied calendar premium at the $850 strike is roughly $2.65 (close to the entry debit of $3.21). The strike ($850) and net debit ($3.21) mark the reference levels; the chart uses a flat 28% IV across all dates for illustration, while live mark-to-market would show the IV term structure flexing through the period.
Greeks Snapshot (Black-Scholes, flat IV 28%)
| Greek | Per-contract value | Interpretation |
|---|---|---|
| Delta (Δ) | +0.07 | Both legs deep OTM (~0.07 delta each); back-month slightly more delta than front-month. Smaller delta than $800 calendar (deeper OTM strike). |
| Gamma (Γ) | +0.0003 | Minimal gamma; both legs well below the strike. Structure is slow-moving until QQQ approaches the strike. |
| Theta (Θ) | +$0.04/day | Net positive theta harvest. Trade makes money from the passage of time if QQQ stays near the strike. |
| Vega (ν) | +$0.30 per 1% IV | Net long vega. Same magnitude as the $800 calendar. Both trades have similar vega exposure. |
| Rho (ρ) | +$0.18 per 1% rate | Mild long rates; negligible. |
Numbers computed at entry spot $691.70, current DTE (511 front, 546 back), IV flat at 28%, r=4.5%, no dividend yield.
Intraday Setup (entry)
- Pre-market context: QQQ closed Jul 23 at $691.70 (down ~7% from June highs near $743). IV term structure: front 27.8% / back 28.2% — slight back-rich inversion, normal for QQQ.
- Entry signal: Paired with the $800 calendar. The $850 strike adds the upside leg of the paired position. Same IV environment; same expiry dates.
- Execution: Limit order at $3.21 debit (OptionStrat basis). Filled at 11:59 AM ET. Live verification: front-month $850C live mid $38.88 vs OptionStrat $38.79 (0.2% gap, within tolerance); back-month $850C live mid $42.25 vs OptionStrat $42.00 (0.6% gap, within tolerance). Net debit live: $3.37 vs OptionStrat $3.21 — within tolerance, no live-execution savings.
Management Plan
- Open through Q3 2027 (~390 DTE on short leg): Hold. Theta is slow but persistent. No major event risk in this window.
- Q4 2027 (~90–30 DTE on short leg): Front-month theta accelerates. Watch the spot-to-strike corridor closely. If QQQ closes between $800 and $900 in any weekly bar, the position is in the profit zone — consider closing at 50% of max profit ($1,400/contract).
- Q4 2027 last 90 days: Close 90 days before Dec 17 '27 short-leg expiry.
- Stop loss: 2× debit ($642/contract cost to close) OR QQQ closes below $620 at any point.
- Joint management with the $800 calendar: Both trades share management deadlines. Set GTC orders at 50% of individual max profit; the trades can be closed independently based on which strike QQQ is approaching.
Status
| Date | QQQ Price | Position Value | P&L | Notes |
|---|---|---|---|---|
| 2026-07-24 (entry) | $691.70 | $321.00 | — | Opened. 1 calendar call spread @ $3.21 debit. IV ~28%. |
Lessons
- For the playbook: A paired-calendar position (two strikes, same expiry) is a non-standard structure that the playbook doesn't directly cover. The mechanics are the same as a single calendar but the payoff shape becomes a "double tent" — closer to a butterfly in shape but with longer-dated optionality. Future playbook entry on paired calendars would be useful, especially around strike-spacing rules (here $50 = ~7% of spot) and combined max-loss position sizing.
Disclosure
The desk may hold the positions, options, or underlyings mentioned in a trade-log entry at the time of publication; positions are disclosed in the trade-log entry itself. Nothing on this site is investment advice.
Disclaimer. This content is published for informational and educational purposes only. Nothing here is investment advice. Trading options involves substantial risk of loss and is not appropriate for every investor. Past performance, including the journal entries on this site, does not guarantee future results. You are solely responsible for your trading decisions.