Opened a QQQ Oct 16 / Oct 30, 2026 650 calendar put spread (79 DTE short): STO -1× QQQ 650P Oct 16, 2026 at $19.01 (OptionStrat basis; live chain mid $19.94) / BTO +1× QQQ 650P Oct 30, 2026 at $21.195 (OptionStrat basis; live chain mid $22.07). Net debit $2.185/share = $218.50/contract (OptionStrat basis). Max profit ~$1,058.34/contract (BSM at flat IV 26.2%: back-month residual TV at $650 with 14 DTE = $12.77/share; max profit = ($12.77 − $2.19) × 100); max loss $218.50 (= net debit). 1-contract sizing. Spot $674.42 at entry (3:27 PM ET); IV ~26% (short 26.1%, long 26.2% — nearly flat, normal QQQ term structure). 14-day calendar duration. AM-settled standard monthly equity options; last trade Thursday 10/15 on the short leg.
Why This Structure
A put-side calendar at a near-ATM strike — the structure expresses the view that QQQ will spend time around $650 over the next 79 days. The trade collects front-month put premium while funding the longer-dated put, with a defined-risk profile bounded by the net debit.
Why a calendar over a diagonal? The diagonal (different strikes + different expiries) would add intrinsic value to the long leg and tilt the trade more directional. The same-strike calendar is the more pure theta vehicle — it doesn't care which direction QQQ moves, only that it ends up near a strike at short-expiry.
Why a put calendar over a call calendar? QQQ is currently in a pullback ($674, off ~7% from June highs near $725). The 14-day front-month IV is barely above the 93-day back-month IV (26.1% vs 26.2%) — flat term structure. Put calendars work when the underlying is expected to chop sideways, especially when spot is near a strike and there's no obvious directional catalyst. A call calendar would require QQQ to rally to a higher strike; a put calendar accepts the current chop and profits if QQQ spends time near $650.
Why not a put vertical? A 650/600 or 650/625 vertical would express the bearish view (QQQ falls below $650) at lower debit. But verticals need QQQ to actually reach the lower strike for max profit. The calendar's tent-shaped peak is centered at $650 with positive P&L on either side of it — a much wider profit zone.
Why $650 strike specifically? $650 sits $24 below current spot. At 26% IV over 79 days, the σ-distance is roughly 0.5σ — within the playbook's standard 0.3–0.5σ band for short-duration calendars. The strike is close enough to spot to capture meaningful time-value asymmetry between the two legs, but not so close that the back-month has only modest residual TV. Picking $650 instead of $700 captures the current pullback reality (QQQ has already corrected 7%) without going so deep OTM that the back-month TV collapses.
Thesis
- Why QQQ, why now: QQQ has corrected ~7% from June highs ($725 → $674). The correction has been orderly; structural drivers (AI capex, mega-cap concentration, low-vol tech regime) are intact but the index needs a base. IV at 26% is moderate — not cheap (which would favor premium-selling) but not panic (which would favor long-vol). The flat term structure (front 26.1% / back 26.2%) suggests the market isn't pricing near-term event risk on either side — the calendar captures the chop.
- Why a put calendar over alternatives: A long 650P Oct 16 alone costs $1,901 (more than 8× the calendar's debit) and would be the pure directional put. A long 650P Oct 30 alone costs $2,120 with the same directional exposure but more theta bleed. A 600/650 put vertical costs ~$2.50 debit with max profit $47.50/share but requires QQQ to fall below $600 by Oct 16, not just reach $650. The calendar wins on three axes: defined risk, theta harvest, and a wider profit zone (any QQQ close between roughly $618 and $687 at Oct 16 produces positive P&L).
- Why not the existing QQQ call calendars ($800 / $850, opened 2026-07-24): Those are 18-month duration calendars expressing an 18-month recovery view to $800–$850. This new put-side calendar is a 79-day duration trade expressing the near-term chop-then-base view at $650. They have completely different time horizons — one is structural recovery, the other is tactical mean-reversion. They don't overlap in payoff or thesis.
- Why 14-day calendar duration: 14 days is the sweet spot for short-duration calendars on QQQ — long enough for the back-month to retain meaningful residual TV at short expiry, short enough for the front-month to decay meaningfully in the holding period. A 30-day calendar (short Oct 30 / long Nov 20) would have less front-month decay per day; a 7-day calendar would have the back-month TV too thin to justify the debit.
Risk
| Risk | Magnitude | Mitigation |
|---|---|---|
| QQQ rallies past $700 at Oct 16 | Up to ~$190 loss above $720 (long leg residual TV erodes to near zero) | Stop before $700; the calendar is asymmetric above the strike — short expires worthless but long loses TV faster than expected |
| QQQ stays well below $617 at Oct 16 | Up to ~$325 loss (long leg intrinsic ≈ short leg intrinsic, plus debit) | Acceptable; this is the trade not playing out. Stop at 2× debit ($437) cost to close |
| QQQ stays at $674 (no move, no chop) | ~$10 loss initially, then theta harvest builds P&L over time | This is the thesis playing out — QQQ stays near $650. Theta should accumulate $1.37/day in the position's favor. Patience |
| IV crush (long-term IV decline) | ~$10.37/contract per 1% IV drop | Position is net long vega; rising IV helps, falling IV hurts. QQQ IV typically stays in 20–35% range; sustained IV collapse to < 20% would hurt the position materially |
| Early assignment risk on short ITM put | Currently low (short is $24 ITM, no ex-div on QQQ before Oct 16) | QQQ does pay ~0.5% annual dividends; an ITM short put with dividend risk could see early assignment to capture the dividend. Monitor ex-div dates (none between now and Oct 16 for QQQ, but verify before settlement) |
| Liquidity (QQQ is highly liquid, low risk) | Front-month bid/ask ~$0.25, back-month ~$0.30 | QQQ is one of the most liquid underlyings; spreads are tight. No concerns |
Position Payoff at Three Time Horizons
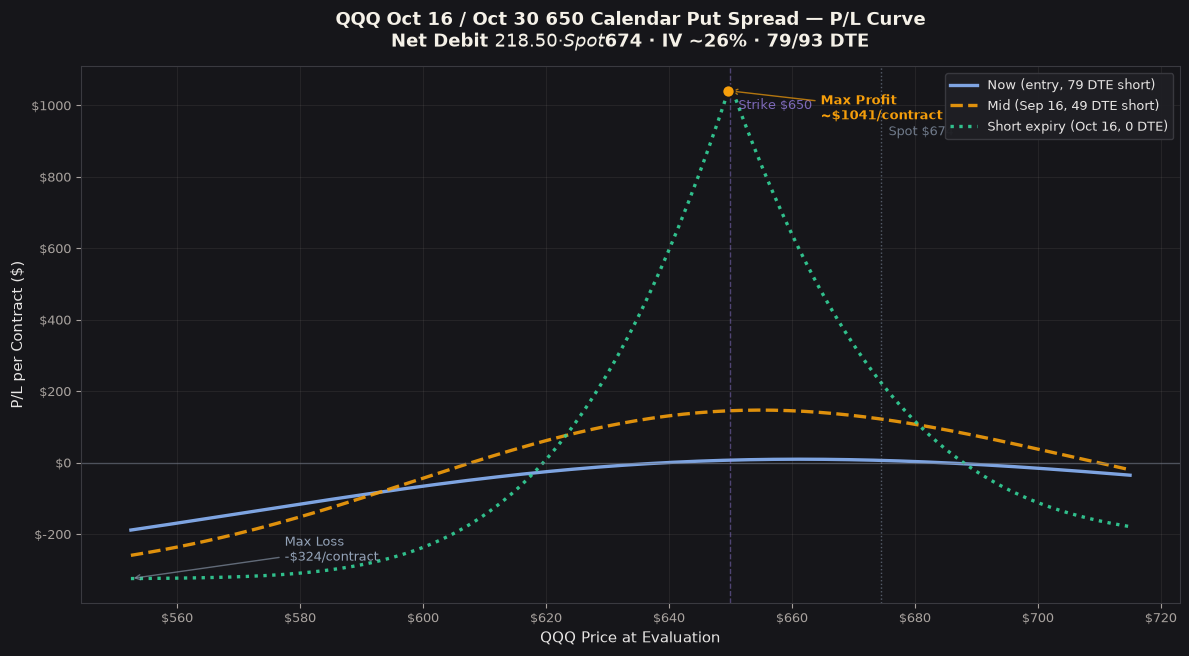
The chart above shows the position's P/L as a function of QQQ's price at three evaluation windows: now (entry, 79 DTE short), mid-life (~30 DTE before short expiry = Sep 16, 2026), and at short-leg expiry (Oct 16, 2026). The three curves diverge in a classic short-duration calendar pattern — the now-curve is shallowly tent-shaped with the strike centered, the mid-curve is steeper as the front-month theta accelerates, and the short-expiry curve is the tallest tent peaking exactly at the $650 strike.
Read the chart:
- Spot $674.42 sits $24 above the strike. At the current spot, the calendar is near-flat (~$0 P/L on the now-curve, building toward positive via theta as the front-month decays). At Oct 16 expiry at the current spot, the strategy shows ~$640 P/L per contract — front expires worthless ($0), long has ~$8.58/share residual TV, minus $2.19 debit = $6.39/share × 100 = $639/contract.
- The peak (~$1,058) sits exactly at $650 at short-leg expiry. That's where the short leg expires worthless and the back-month retains 14 DTE of time value at the strike ($12.77/share = $1,277/contract, minus $218.50 debit = $1,058.34/contract).
- The downside tail (QQQ crashes through $617) bottoms at ~−$325/contract at $550. Below the lower breakeven, both legs are deep ITM; short pays out more intrinsic than long captures (because the long's value converges to the same intrinsic), and the debit is the loss.
- The upside tail (QQQ rallies past $687) crosses zero around $687 and bottoms at ~−$190/contract at $720. Above the upper breakeven, the long leg loses TV faster than the debit recovers.
Tent shape asymmetry: The upside tail is shallower and the downside tail is steeper. This reflects the put skew — OTM puts trade richer than OTM calls at the same distance, so the downside back-month residual TV decays faster than the upside. The breakeven window (~$618 to $687) is wider on the upside (+$37) than the downside (−$32) — the structure tolerates a moderate rally better than a moderate selloff.
Greeks Snapshot (Black-Scholes at entry)
| Greek | Per-contract value | Interpretation |
|---|---|---|
| Delta (Δ) | −0.48 | Mild net put delta. QQQ needs to fall ~$0.50 from here for the structure to gain $1 of delta-neutral P&L. |
| Gamma (Γ) | −0.0338 | Slight net short gamma. Position loses value if QQQ moves sharply in either direction intraday (small effect at this scale). |
| Theta (Θ) | +$1.37/day | Net positive theta — this is the trade's edge. Front-month decays faster than back-month at this DTE bucket. |
| Vega (ν) | +$10.37 per 1% IV | Net long vega. Structure wants IV to rise to add value; a sustained IV crush hurts. |
| Rho (ρ) | −$10.66 per 1% rate | Mild short rate sensitivity. Fed policy moves during the holding period could affect the trade. |
Per-leg breakdown (BSM at entry): 650P −1× $19.01 / delta −0.330 / gamma +0.0044 / theta −0.159 / vega +1.136 / rho −0.522; 650P +1× $21.195 / delta −0.335 / gamma +0.0041 / theta −0.146 / vega +1.240 / rho −0.629. Net per-share: delta −0.0048, gamma −0.0003, theta +0.0137, vega +0.1037, rho −0.1066. Multiply by 100 for per-contract values shown above.
Intraday Setup (entry)
- Pre-market context: QQQ traded flat-to-down overnight after yesterday's −0.8% close. Futures pointed to a modestly lower open; no major economic data on the calendar for July 29. The 14-day front-month put IV (26.1%) was slightly elevated relative to the back-month (26.2%) — nearly flat, slight front richness. This is a textbook environment for a put-side calendar: a chop-zone setup with no directional catalyst and a balanced term structure.
- Entry signal: At 3:27 PM ET, checked the chain at the $650 put strike for both Oct 16 and Oct 30. The basis prices were $19.01 (short) and $21.195 (long), netting $2.185 debit. The implied vol surface gave ~26% on both legs — within the BSM solve tolerance (~$19.94 chain mid implied 27%, ~$22.07 implied 26.9%, both slightly higher than basis, suggesting a small amount of slippage is expected at fill).
- Execution: Both legs entered simultaneously at the OptionStrat basis prices (a single combined order through the strategy builder). Slippage should be minimal — QQQ options are highly liquid.
- Size check: Total debit $218.50 = 2.19% of $10k trade-book allocation for QQQ short-duration calendars. Within the playbook's 3% per-trade cap.
Management Plan
| Trigger | Action |
|---|---|
| 50% of max profit (~$529/contract) | Close the trade. Lock in half the potential upside; the back-month residual TV is hard to predict beyond this point. |
| QQQ within ±$5 of $650 at Oct 16 | Hold if 50% not hit; the tent peak is the most profitable spot to ride to expiry. |
| QQQ outside ±$35 of $650 at Oct 16 | Close at market, even if a small loss. The structure has lost its tent-shape edge. |
| 5 days before short expiry (Oct 11) | Force-close if not at the 50% target. Avoid gamma/assignment risk into the last week. |
| 2× debit stop ($437/contract cost to close) | Hard stop. The trade is no longer a calendar at this point — it's directional risk. |
| QQQ above $720 at any time | Close the position. The back-month residual TV erodes to zero above $700; the structure has no edge. |
| QQQ below $580 sustained | Close at market. The structure has gone deep ITM and the loss is approaching the debit. |
| IV crush to < 18% sustained for 5+ days | Reduce position size or close. Long vega exposure is no longer favorable. |
| Pre-FOMC / Pre-CPI (Sep 16–17, Oct 14–15) | Hold through event unless IV is below 20% entering the event. Calendar structures benefit from event IV expansion. |
Adjustment idea (advanced): If QQQ moves substantially in the first 2 weeks and stays there, the calendar can be rolled forward (close both legs, reopen at the next pair of expirations 30–60 days out). This converts a chop trade into a longer-duration theta position with a new profit zone.
Status
| Date | QQQ Close | Position Value | Unrealized P&L | Notes |
|---|---|---|---|---|
| 2026-07-29 (entry) | $674.42 | −$218.50 | — | Opened at OptionStrat basis. Spot $24 above strike. Front-month IV 26.1% / back-month 26.2%. |
Outcome
| Metric | Value |
|---|---|
| Realized P&L | To be filled when the trade closes (full close, 50% profit target, or stop). |
| Holding time | Not disclosed in the source |
| Net theta captured | Not disclosed in the source |
| Remaining premium | Not disclosed in the source |
| Hit target? | Not disclosed in the source |
Lessons
To be added after the trade closes. Pending observations: how the calendar behaves in the first 2 weeks, whether QQQ's chop-zone thesis plays out, and what the actual max-profit realization looks like vs the $1,058 BSM estimate.
Sourcing
Spot price and option chain mid from the live data feed at entry. Risk-free rate 4.27% (1-month Treasury per the curve). Basis prices from OptionStrat's strategy basis ($19.01 / $21.195; live chain mid $19.94 / $22.07).
Disclosure
The desk may hold the positions, options, or underlyings mentioned in a trade-log entry at the time of publication; positions are disclosed in the trade-log entry itself. Nothing on this site is investment advice.
Disclaimer. This content is published for informational and educational purposes only. Nothing here is investment advice. Trading options involves substantial risk of loss and is not appropriate for every investor. Past performance, including the journal entries on this site, does not guarantee future results. You are solely responsible for your trading decisions.