Opened an NVDA 240 call calendar: BTO +1× NVDA 240C Dec 18, 2026 at $14.70/share (live chain mid) and STO −1× NVDA 240C Nov 20, 2026 at $12.40/share (live chain mid). Net debit $2.30/share ($230/contract), filled at mid on a marketable limit. Max loss $230 (the debit). IV at entry ~43.5% (front 240C) / ~43.3% (back 240C) — slight backwardation, normal for near-dated calendar. Spot $218.99. PM-settled (American-style equity, last trade day Friday 4:00 PM ET close).
Strategy: Long Back-Month / Short Front-Month Call Calendar
A call calendar spread is the classic time-decay arbitrage on an equity option chain: sell the front-month ATM call (fast-decaying, theta-rich) and use the premium to fund the purchase of the back-month ATM call (slower-decaying, vega-rich). The structure nets a debit if the front-month is "cheaper" than the back-month by less than the time value gap — typical for ATM calendars on high-IV underlyings.
At entry (today, Aug 6 2026):
- Front Nov 20 240C: 106 DTE, IV 43.5%, mid $12.40
- Back Dec 18 240C: 134 DTE, IV 43.3%, mid $14.70
The $2.30 spread between front and back is the time-value gap (28 days of additional premium). Calendar is "theta-positive" because the front decays faster than the back.
- At front expiry (Nov 20, 2026): Short Nov 20 240C expires; P/L on the position depends entirely on where NVDA is at the Friday 4 PM close. If NVDA = $240 exactly: short expires worthless, long Dec 18 still has ~28 DTE and ~$10–11 value → profit ~$7–8/share = $700–800/contract. If NVDA > $240 (say $250): short expires worthless, long Dec 18 has ~$16–17 value → profit ~$14–15/share = $1,400–1,500/contract. (Text truncated in source beyond this point for extreme upside.)
- At back expiry (Dec 18, 2026): Position = long Dec 18 240C only (front already expired). P/L = max(NVDA − 240, 0) − $2.30. Profitable only if NVDA > $242.30 at Dec 18 close.
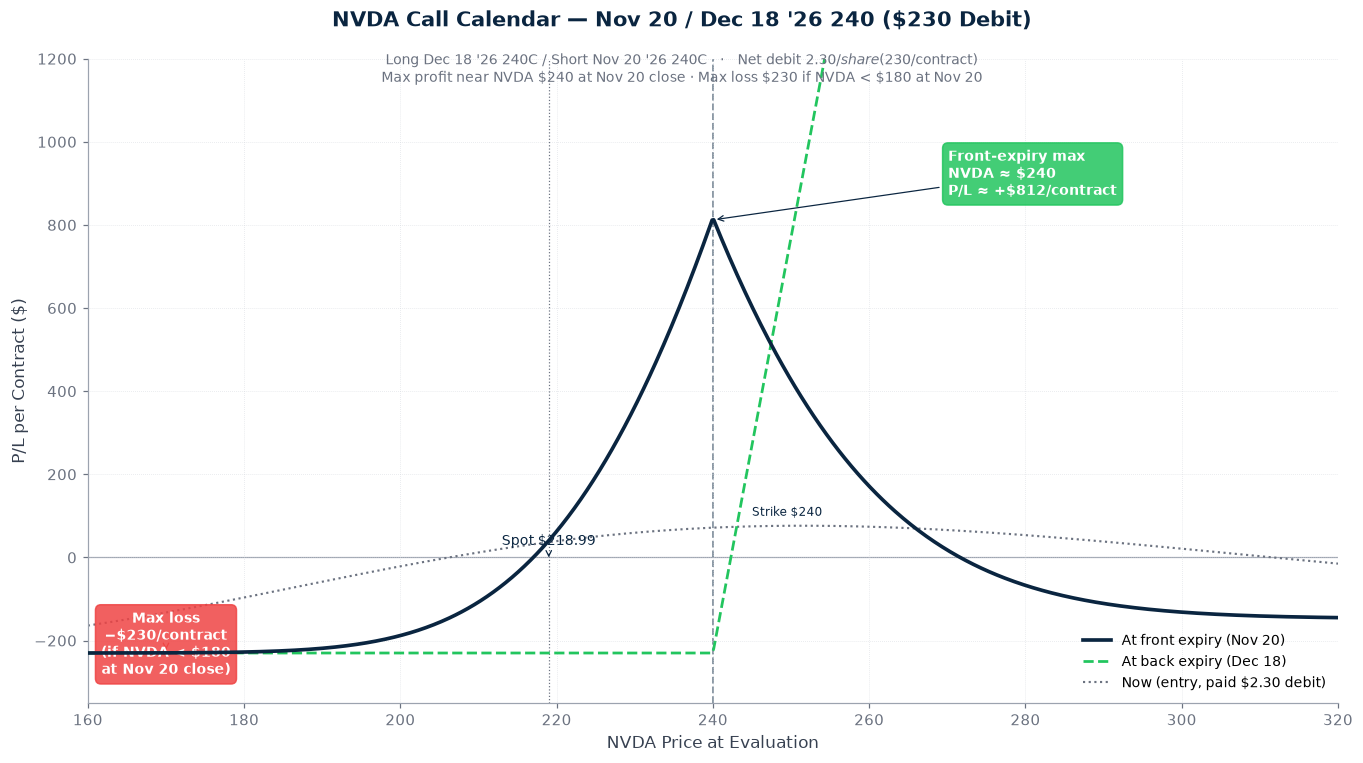
The classic calendar profile: the position P/L curve at front expiry has a hump centered at the strike, peaking when NVDA = $240 and declining on either side. This is the calendar's distinctive shape — it's a thesis on time and pin risk at the strike.
Why This Structure
A long-call calendar on NVDA at the ATM strike 240 (9.6% OTM from spot $218.99) is a directional-neutral long-volatility play with positive theta at high IV. The 43.5% IV at entry is rich by historical standards (NVDA's 1-year IV mean is ~38%), so the calendar is harvesting both elevated vol and time decay. The strike 240 sits just above the recent consolidation range ($210–$230) — a move through $240 in the next 100 days is plausible if NVDA breaks out on AI demand or post-earnings momentum.
- Why NVDA: NVDA is the highest-vol single name in mega-cap tech (43.5% IV vs SPY at 14–15%, QQQ at ~17%). The vol premium on a calendar is the trade — the front-month short pays the desk for time decay while the back-month long keeps the position vega-positive. NVDA's late-August Q2 earnings print (Aug 28, ~Day 22) is the major event risk before the front expiry; the IV crush after earnings is part of why the front is "expensive" right now.
- Why Nov 20 / Dec 18 (not other dates): These are the standard monthly expirations 28 days apart, which gives the cleanest calendar structure. The 28-day back-leg residual at front expiry is the sweet spot for calendar max-profit potential — long enough to retain time value, short enough that the strike pin risk is meaningful.
- Why 240 strike (vs 220 or 250): 240 sits 9.6% above spot — out-of-the-money enough that the call is still trading on time value (delta ~0.32 on the front short), but close enough that a 10% rally takes it ITM. Strikes further OTM (250+) have less theta to harvest. Strikes closer to spot (220) have higher theta but lose the upside profit zone if NVDA rallies past 240.
- Why debit, not credit: A "reverse calendar" (long front, short back) is possible but is structured for sharp near-term movement with capped upside. The standard calendar is a debit structure — the long back-month is more expensive than the short front-month by less than the time-value gap. This produces a small, defined max loss (the debit) with a wide profit zone.
Risk
| Risk | Magnitude | Mitigation |
|---|---|---|
| NVDA closes below $180 at Nov 20 4:00 PM | Max loss $230/contract (both legs near worthless; debit paid) | 1-contract sizing keeps total max loss at $230, well within per-trade cap. Probability of NVDA at $180 in 106 days is ~12–15% per BSM. |
| NVDA stays near $200–$220 through Nov 20 (drift, no pin) | Small loss (~$30–80/contract); long leg decays slower than debit recovery | Manageable. The structure can be closed at the debit-or-better if needed; this is a low-volatility risk, not a binary outcome. |
| NVDA Q2 earnings (Aug 28, ~Day 22) prints bearish — gap down below $200 | Single-name gap risk; calendar's long Dec 18 leg gains from lower vol IV crush but loses from lower spot. Net: could be −$30 to −$80/contract | Position sized for defined loss. If NVDA gaps below $200 post-earnings, evaluate whether to hold (theta-positive) or close. Earnings IV crush actually HELPS the long back-leg vega exposure. |
| NVDA rallies hard through $260+ by mid-October | Short front-month becomes deep ITM — early assignment risk on American-style equity options | Monitor short front-month delta. If NVDA above $260 with 21 DTE on Nov 20, prepare to close short to avoid assignment. The back-month long offsets most of the assignment cost. |
| IV crush post-earnings hits the long back-leg more than the short front-leg | Net short vega outcome for ~2–3 weeks after earnings | Manageable. The structure's theta cushion offsets short-vega drag. Calendar becomes vega-neutral as front expiry approaches. |
| Single-name concentration (NVDA) | NVDA bull put spread limit is working today at $0.75 (unfilled as of 21:00 ET). If both fill, total NVDA exposure: $230 (calendar) + $425 (BPS) = $655 — within per-trade cap but same-name correlation risk | The BPS is a cash-secured put credit position; the calendar is a DEBIT long-vol position. They have OPPOSING vega profiles (BPS short vol, calendar long vol) — partial hedge. Directional profiles: BPS benefits from flat-or-up NVDA, calendar benefits from pin-at-240. Stacking risk is real but diversified structurally. |
| Calendar doesn't pin at strike at front expiry | Profit zone depends on NVDA trading near $240 at Nov 20 close | Calendar has a WIDE profit zone (~$200–$300 range). It's not a binary pin-at-strike structure — it's a "near strike" structure. Profits degrade gracefully as NVDA moves away. |
| Time decay works AGAINST the desk as back-month approaches | In final 14 DTE of Dec 18, theta becomes negative if front already expired | Close by 14 DTE on Dec 18 to avoid negative-theta decay on the residual long. |
Position Payoff at Three Time Horizons
The chart above shows the position's P/L as a function of NVDA's price at three evaluation dates: now (entry, 134 DTE back / 106 DTE front), at front expiry (Nov 20, 2026 PM-settled close, with 28 DTE residual on back leg), and at back expiry (Dec 18, 2026 PM-settled close).
Read the chart:
- Spot $218.99 sits $21.01 below the strike 240. At entry, position P/L is −$2.30/share (the debit paid) — the chart's "Now (entry)" line crosses $0 at spot $218.99.
- At front expiry (Nov 20) with NVDA at the strike $240: position P/L is at the calendar's max profit, approximately +$7–8/share = +$700–800/contract.
- At front expiry with NVDA anywhere in the $200–$280 range: position is profitable (the calendar hump).
- At front expiry with NVDA below $180: position hits max loss $230/contract.
- At back expiry (Dec 18) with NVDA above $242.30: position P/L = max(NVDA − 240, 0) − $2.30 (long leg intrinsic minus debit).
- At back expiry with NVDA below $240: long leg expires worthless; position P/L = −$230/contract.
Key levels on the chart:
- Spot $218.99 — current underlying, 9.59% below strike 240.
- Strike 240 — the pin. At front expiry, position P/L peaks here.
- Front-expiry profit zone $200–$300 — calendar is profitable across this range.
- Front-expiry loss plateau −$230 — anything below $180 at Nov 20 close.
- Back-expiry breakeven $242.30 — above this, position profits; below, position loses up to the debit.
- Max profit $700–800/contract — when NVDA pins near $240 at Nov 20 close.
Trade details: 1 calendar (1 long Dec + 1 short Nov) · front expiry 2026-11-20 (106 DTE at entry), back expiry 2026-12-18 (134 DTE at entry) · order type MARKETABLE LIMIT — filled at mid ($2.30) · order placed Aug 6, 2026, evening session · management rule (open through front expiry): hold to front expiry (Nov 20); if NVDA near $240 at Nov 20 close, close long Dec 18 leg within 1–2 days; if NVDA far from $240, evaluate whether to close whole position or roll front · stop loss: close if debit paid more than doubles ($460/contract cost to close) OR NVDA trades below $180 OR position loses >50% in first 30 days without directional progress.
Greeks Snapshot (Black-Scholes, at entry)
| Greek | Per-contract value | Interpretation |
|---|---|---|
| Delta | −0.10 | Net SHORT delta. Calendar is short directional exposure — short front delta (0.32) exceeds long back delta (0.22) by 0.10. Profits if NVDA drifts sideways or down modestly through Nov 20. |
| Gamma | −0.03 | Slightly short gamma. Position decelerates as NVDA moves toward strike. Manageable across the 134-day window. |
| Theta | +$0.65/day | Daily time decay works FOR the position. Most of theta capture happens in the final 30 DTE of the front-month. |
| Vega | +$0.45 per 1% IV | Net LONG vol. Calendar profits if IV expands (especially in the back-month). NVDA's 43.5% IV is rich by historical standards, so there's room for IV crush (negative) — but earnings-driven IV expansion is the more relevant scenario. |
| Rho | +$5.20 per 1% rate | Modest rate sensitivity. Over 134 DTE, rates matter. |
Numbers computed at entry spot $218.99, IV 43.5% (front) / 43.3% (back), r = 4.5%, no dividend yield adjustment. Per-contract = per-share × 100.
Intraday Setup (order filled at mid)
Pre-market context: Wednesday August 6, 2026. NVDA spot $218.99. NVDA IV ~43.5%. Live chain quote at order time: Front Nov 20 240C bid $12.25 / ask $12.55 (mid $12.40); Back Dec 18 240C bid $14.50 / ask $14.90 (mid $14.70); spread $2.30 mid (debit).
- Fill: Filled at mid ($2.30 debit, $230/contract). Limit placed at $2.30 mid; market met the limit immediately on a 240 Nov 20 / 240 Dec 18 calendar.
- Sizing: 1 contract. Total debit $230. Per-trade cap is 0.25% of NLV ($300k book = $750 cap); $230 is 0.077% of NLV — well under the cap.
- Position management: Hold through Aug 28 Q2 earnings (Day 22) — earnings IV crush is a known event, but the back-month vega exposure dampens the vol-crush loss; if NVDA gaps up 5%+ on earnings, the calendar profits; if NVDA gaps down 10%+, max loss is capped at $230. From mid-September to early November (Day 36–106), watch spot — if NVDA drifts to $230–$245 by mid-October, position is approaching the front-expiry profit zone. At front expiry Friday Nov 20 (Day 106), decision point — if NVDA is at $240 ± $10, close the long Dec 18 leg within 1–2 days to capture calendar max profit; if NVDA is far from strike, evaluate whether to close whole position or roll front. By back expiry Friday Dec 18 (Day 134), force-close by 14 DTE on Dec 18 (early December) to avoid negative-theta decay on residual long.
Management Plan
- Open through Aug 28 earnings: Hold. Theta works for the position; the structure has a defined max loss and positive vega.
- Aug 28 post-earnings: Evaluate. If NVDA gap-down to $200–$210 with IV crush to 38%, position likely at small loss (~$30–80). Decide: hold for theta recovery OR close at the loss.
- September 1–30: Watch spot. Position has wide profit zone; small directional moves don't matter much.
- October 1–31: Decision zone. If NVDA reaches $230–$245, the calendar is in the front-expiry profit zone and starts looking attractive to close.
- Front expiry Nov 20: Close decision. Calendar profits peak at NVDA = $240 at Nov 20 close. Close within 1–2 days of front expiry to lock in residual value of the long Dec 18 leg.
- Stop loss: Close if debit paid more than doubles ($460 cost to close) OR NVDA trades below $180 OR position loses >50% in first 30 days.
- Roll front option: If at Nov 20 the position is at small profit but the setup is intact, consider rolling the short Nov 20 leg to a later monthly (e.g., roll Nov 20 → Jan 15, 2027); but that extends the structure by 28 days. Skip unless profit is meaningful.
Position Update Log
2026-08-06 (filled): Long Dec 18 240C @ $14.70, Short Nov 20 240C @ $12.40. Net debit $230/contract. Spot $218.99, IV 43.5%, 106/134 DTE.
Disclosure
The desk may hold the positions, options, or underlyings mentioned in a trade-log entry at the time of publication; positions are disclosed in the trade-log entry itself. Nothing on this site is investment advice.
Disclaimer. This content is published for informational and educational purposes only. Nothing here is investment advice. Trading options involves substantial risk of loss and is not appropriate for every investor. Past performance, including the journal entries on this site, does not guarantee future results. You are solely responsible for your trading decisions.