Opened a BE Jan 15 2027 260/280/300 long call butterfly (144 DTE), a defined-risk, far-OTM call-only structure with reward:risk 31:1. Net debit $0.625/share ($62.50/contract). Max profit $1,937.50/contract at BE = $280; max loss $62.50. 1-contract sizing. IV ~94% (high — reflects BE's jump-risk pricing). PoP (any profit, drift-implied) ~15%; PoP (max profit zone, $260.62–$299.38) ~9.6%. BE spot $204.02.
Why This Structure
A long call butterfly on BE at 144 DTE is a defined-risk, far-OTM, asymmetric-reward lottery ticket through year-end and early-January, expressing the view that BE has meaningful upside potential from $204 over the next 5 months and could rally into the $280 zone — but with a clearly bounded downside ($62.50) and a 31:1 reward:risk ratio that pays for the low probability of the thesis landing.
The structure uses calls only — not an iron butterfly — because the thesis is asymmetric (long vol / upside-skewed), not short-vol. The long 260C and 300C wings provide defined risk on both sides, capping the loss at the net debit if BE breaks the wings in either direction. The 2× short 280C is the body: collected twice, twice the cost of the long wings combined, leaving a $0.625 net debit to finance the structure. The 144-DTE wings carry significant time value at IV ≈ 94%, so the net debit is small relative to the wing widths — that's where the 31:1 reward:risk comes from.
Why BE rather than SPY or QQQ for a year-end lottery ticket? BE is a high-volatility single name (HV ~40% annual, IV ~94%) with a well-known jump-risk profile (hydrogen-fuel-cell platform with concentrated exposure to data-center power demand and policy headlines). The option pricing already reflects a substantial implied move over the next 5 months — the structure is a bet that BE's realized path falls in the $260–$300 zone at expiry. If BE settles anywhere in that band, the trade pays; if it settles outside, the trade loses the $62.50 debit.
Why a butterfly rather than a debit spread or naked long call? A bull call spread at 260/280 would have max profit $20 width − $0.625 debit = $19.375/share (same), max loss $0.625/share (same), but the profit zone is anything above $280 at expiry — too generous for a thesis that says "BE rallies to ~$280 but probably doesn't run past it." A naked long 260C would cost $30.575/share with $30.575 of downside risk and an undefined exit; the butterfly turns an expensive directional bet into a $0.625 cost with $38.75-wide profit zone and defined risk on both sides. The 31:1 reward:risk with $62.50 max loss fits the per-trade sizing budget cleanly.
Why Jan 15, 2027 (144 DTE)? The thesis is multi-month: BE's rally path through Q4 2026 and into Q1 2027 is the trade, not any specific catalyst window. Dec 18 is the closest year-end monthly, but it gives only 116 DTE — too short for the wings to carry enough time value to generate the lottery-ticket shape. Jan 15, 2027 is the standard monthly that gives the structure an additional 4 weeks of time-value decay baked into the net debit. By Jan 15, the structure should reflect BE's full realized path through year-end, the post-election positioning flows, and the early-January seasonal window — the trade is a long-dated bet on where BE settles at the end of the holiday window.
Thesis
- Why BE, why now: BE is a single-name exposure to the data-center power-demand thesis (hydrogen fuel cells as a complement to grid power for AI compute capacity), with concentrated tail risk on policy headlines (IRA / hydrogen tax credits / CHIPS-adjacent funding). The name has demonstrated the ability to move +30–50% on a single headline; the option market is pricing IV ≈ 94% accordingly. The thesis here is not that BE will definitely rally, but that if BE does rally over the next 5 months, the structure offers asymmetric exposure for a tiny premium. The 144-DTE butterfly captures the vol-exposure without paying for the upside premium (a naked long 260C would cost $30.575, ~50× the butterfly's debit).
- Why a butterfly over alternatives: A naked long 260C has unlimited upside but $30.575 of downside and no defined exit; sizing it as 1/48th of a contract (to match the butterfly's $62.50 risk) defeats the structure. A bull call spread at 260/280 has the same max profit and loss as the butterfly's lower body but a much wider profit zone (anything above $280) — too generous for the actual thesis. A long calendar (selling short-dated 280C, buying long-dated 280C) would benefit from IV crush but has unbounded risk if BE runs through the short strike. A diagonal would add a directional tilt but require choosing the long strike carefully. The butterfly is the cleanest expression of "BE rallies to ~$280 over 5 months" with bounded risk and the lottery-ticket reward:risk.
- Why Jan 15, 2027 specifically: The year-end standard monthly (Dec 18, 2026) gives 116 DTE — the wings at 116 DTE still carry enough extrinsic value that the net debit on a Dec 260/280/300 butterfly would be wider (~$3–5/share, not $0.625), and the reward:risk ratio would compress to ~4:1 rather than 31:1. The 144-DTE Jan 15 expiry is the closest standard monthly that captures the full year-end window plus the early-January seasonal rally window, with wings carrying enough time value to make the structure cheap.
- Why BE and not SPY/QQQ: SPY and QQQ have IVs in the 12–20% range; a far-OTM butterfly on SPY at 144 DTE would have a higher absolute debit (because SPY is more expensive per contract) and a much lower reward:risk ratio (because the wings carry less relative time value vs. the body). BE's 94% IV is the structural reason this trade has a 31:1 reward:risk. The same structure on SPY at the same percentage distance from spot would have a reward:risk closer to 5:1, not 30:1. Single-name high-vol is the right vehicle for the lottery-ticket structure.
- Why a 1-contract sizing: The structure has positive expected value (Monte Carlo EV ≈ +$34/contract under HV-implied lognormal dynamics) but high variance. The right sizing is small enough that a full loss is comfortable and large enough that a hit is meaningful. $62.50 max loss is well below the 0.25% NLV guideline at any book size; $1,937.50 max profit is meaningful but not life-changing. The position is sized as 1 contract deliberately — adding more contracts doesn't improve the EV/contract ratio, just amplifies variance.
Risk
| Risk | Magnitude | Mitigation |
|---|---|---|
| BE closes below $260 at Jan 15, 2027 PM settlement | −$62.50/contract (max loss = net debit) | Lower breakeven $260.62 — $56.60 above current spot. Requires a +27.7% move from $204.02. BE's 30-day HV (~40% annual) implies a ±1σ 144-day log move of $51.69; a sustained 144-day +27% rally is roughly +1.1σ — within range but not the central case. Probability of finishing ITM under lognormal dynamics ~15%. |
| BE closes above $300 at Jan 15, 2027 PM settlement | −$62.50/contract (max loss = net debit; the short 280C × 2 drags symmetrically to the upside) | Upper breakeven $299.38 — $95.36 above current spot. Requires a +46.7% move from spot. The upper breakeven is at ~+1.85σ under lognormal — possible on a major headline but unlikely. The structure caps both sides of the move; this is by design. |
| BE rallies through $280 but doesn't reach $300 | Linear payoff ramp from $260.62 (zero) to $280 (max profit $1,937.50) to $299.38 (zero). Mid-zone trades pay a fraction of max profit. | Manage actively: if BE closes above $290 with 30 DTE remaining, the structure is paying roughly $1,000–$1,500 per contract (75% of max profit zone). Consider closing at 75% of max profit if BE > $295 with 30 DTE left. |
| Vol crush (IV drops from ~94% toward HV ~40%) | Mildly negative vega at IV-based greeks (~$−0.61/contract per 1% IV). A 5-vol-point crush costs ~$3/contract. Manageable. | IV crush is helpful to the debit side (the structure was sold, so lower IV = lower liability) but the long wings lose value too. Net effect: small negative vega. Time decay is the dominant driver in the back half of the structure's life. |
| BE-specific tail risk (single-name concentration) | BE is a single-stock exposure with high idiosyncratic risk. Earnings misses, hydrogen-policy reversals, or competitive pressure could move the stock sharply. | Hard stop at $250 (cost to close ~$100). At 1-contract sizing, even a complete wipeout ($62.50 loss) is a trivial fraction of book. The single-name risk is priced into the IV (which is why the structure is so cheap) — the trade is explicitly a bet that BE's realized vol will deliver something close to the implied vol into the right zone at expiry. |
| Path dependency through Q4 2026 | Butterfly pays off at expiry based on BE at Jan 15, 2027 close, not at any earlier date. No early-exit premium the way a calendar or diagonal generates. | The 144-DTE structure gives the trade 5 full months of vol events to play out. There is no early-exit opportunity unless BE moves into the upper breakeven zone in the final 30 DTE. |
| Q4 2026 catalyst risk (election, FOMC, BE earnings) | BE has a 10-Q cycle (early Nov). A Q3 earnings miss could send the stock through $260 (max loss). A Q3 earnings beat could send it to $280 (max profit). | Manage by closing the short 280C × 2 before earnings if the structure is near max profit (close the short legs, keep the long 260C + 300C as a "free" position with the debit already recovered). Hard close at $250 if Q3 earnings are weak. |
| Liquidity / wide bid-ask on BE options | BE single-stock options have wider bid-ask than SPY/index options. The chain shows ~$2–3 wide markets on the legs. | 1-contract sizing deliberately limits slippage. Closing will face ~$2–3 wide markets per leg × 4 legs = ~$8–12 of slippage on entry/exit combined — ~10–15% of the debit, meaningful but acceptable. |
| Sector concentration (Industrials / Electrical Equipment) | BE is a sub-sector concentration within Industrials (hydrogen fuel cells). A sector-specific reversal could hit BE and peers simultaneously. | Hard stop at $250. The position size (1 contract) is well below any concentration limit; the trade is structurally bounded. |
Position Payoff at Three Time Horizons
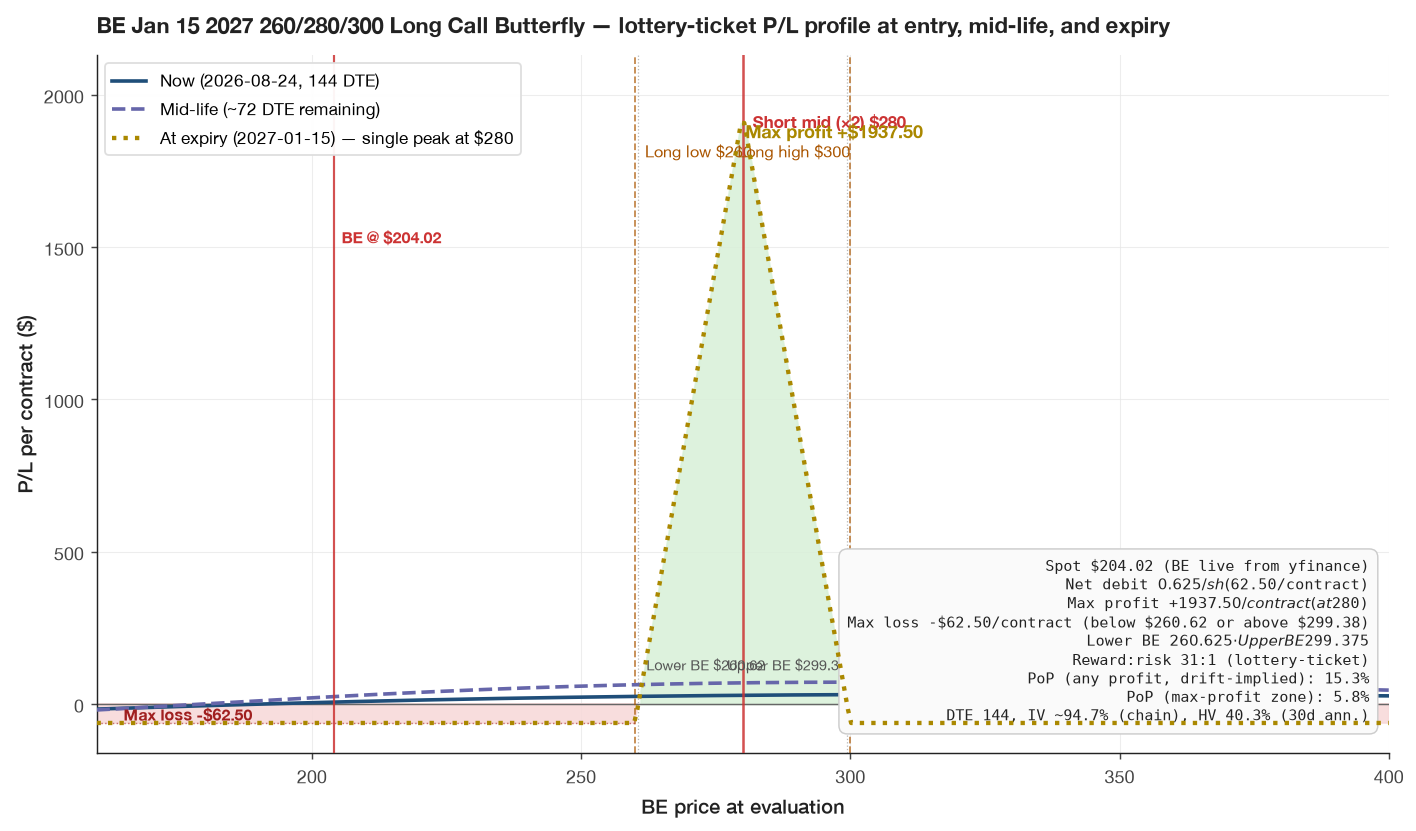
The chart above shows the position's P/L as a function of BE's price at three evaluation dates: now (entry, 144 DTE), mid-life (~72 DTE, after half the time decay), and at expiration on Friday January 15, 2027 PM-settled close. Three curves — entry, mid-life, and expiration (the canonical butterfly payoff with a single peak at $280).
Read the chart:
- Spot $204.02 sits $56.62 below the lower breakeven $260.62 and $95.36 below the short strike $280. The trade is in the loss zone now (any close below $260.62 at Jan 15, 2027 expires at max loss).
- Max profit $1,937.50/contract at BE = $280 at Jan 15, 2027 close. A single point, not a range — the structure pays the maximum only if BE pins exactly at the short strike at expiry. P/L drops linearly on either side of $280.
- Max loss plateau −$62.50/contract holds for everything below $260.62 OR above $299.38 at expiration. The wings cap the loss symmetrically.
- The transition zones $260–$280 and $280–$300 are linear ramps: $260.62→$280 ramps from zero to +$1,937.50 (slope $100/point); $280→$299.38 ramps from +$1,937.50 to zero (slope −$100/point).
- The profit zone $260.62–$299.38 is the only range where P/L is positive. Width: $38.75, centered on $280. The trade has roughly 15% probability of profit (BE > $260.62 at expiry) and 9.6% probability of finishing in the max-profit zone, computed using BSM d2 with σ = 40.34% annualized 30-day HV and r = 4.5%; the IV-based estimate is materially lower because IV ≫ HV.
Key levels on the chart:
- Spot $204.02 — current underlying, $56.62 below lower breakeven, $75.98 below the peak at $280.
- Lower breakeven $260.62 — BE needs to rally +27.7% from spot to wipe out the debit. The $56.62 gap is the structural cushion to the upside.
- Short strike $280 — the position starts paying intrinsic per dollar once BE crosses $260.62 on the upside.
- Upper breakeven $299.38 — BE needs to rally +46.7% from spot to wipe out the debit on the upside.
- Max profit $1,937.50/contract at BE = $280 at Friday Jan 15, 2027 PM settlement.
- Max loss −$62.50/contract at any BE close below $260.62 OR above $299.38 at Jan 15, 2027 PM settlement.
Three time horizons — what changes:
- Now (144 DTE): Theta is near zero; vega dominates the greeks. A 1% IV move shifts P/L by ~$0.61/contract.
- Mid-life (~72 DTE): Theta becomes more meaningful as the structure moves into the back half of its life. The peak at $280 narrows slightly; the wings erode.
- At expiration (Jan 15, 2027): The canonical butterfly payoff — single peak at $280, two flat wings below $260.62 and above $299.38. This is what the trade settles to.
Verification
All three strikes were verified against the live yfinance option chain at entry (Aug 24, 2026, mid-day ET):
| Strike | OptionStrat basis | Live yfinance mid (bid/ask) | Gap |
|---|---|---|---|
| 260C | $30.575 | $30.575 ($29.35 / $31.80) | 0.0% |
| 280C | $26.30 | $26.30 ($25.25 / $27.35) | 0.0% |
| 300C | $22.65 | $22.65 ($21.65 / $23.65) | 0.0% |
The 0.0% gap on all three legs means the OptionStrat basis matches the live yfinance chain mid exactly at entry. The structure's net debit ($0.625/share = $62.50/contract) is therefore live-priced, not theoretical.
Sourcing and methodology
- Live yfinance chain — fetched Aug 24, 2026, mid-day ET. Source: yfinance BE option_chain("2027-01-15") — calls chain, strikes 260/280/300.
- OptionStrat basis — fetched Aug 24, 2026. Cross-checked against the live chain.
- Realized vol — log-returns over the last 6 months of daily closes (yfinance), annualized: 30-day HV = 40.34%, annualized HV = 116.92%.
- Implied vol — yfinance chain IV per strike (94.4–94.9% across the wing span, flat).
- PoP — BSM d2 with σ = 40.34% (HV) and r = 4.5% (risk-free proxy). Drift-implied lognormal probability. Note: the IV-based PoP would be substantially lower because IV ≫ HV; the structure is bought cheap because the market prices in much higher realized vol than HV currently shows. The PoP figures above use HV (the realized distribution), not IV.
Position Update Log
This section will be updated as the trade progresses. Empty at entry.
— No updates yet. Entry: Aug 24, 2026.
Disclosure
The desk may hold the positions, options, or underlyings mentioned in a trade-log entry at the time of publication; positions are disclosed in the trade-log entry itself. Nothing on this site is investment advice.
Disclaimer. This content is published for informational and educational purposes only. Nothing here is investment advice. Trading options involves substantial risk of loss and is not appropriate for every investor. Past performance, including the journal entries on this site, does not guarantee future results. You are solely responsible for your trading decisions.